Saturday, July 25, 2015

How to Talk to Radio-Sky Spectrograph

Solar flare recorded on our very first radio spectrograph at the Lanihuli observatory on Oahu.  This is the ten minute (approx) view.  A more detailed one minute view is also available.  The frequency in MHz is displayed on the right.
Radio-Sky Spectrograph (RSS) was designed specifically to display solar and Jupiter radio spectra. When we (Richard Flagg and I) designed our first HF spectrograph, the FS200 (still operating  more that 10 years later at the Windward Community College Lanihuli Observatory in Hawaii), we  limited ourselves to 200  "channels" or frequencies for each "scan" or "sweep".  We also tried to obtain 10 scans per second.  These parameters were arrived at based on an educated guess as to what we could physically accomplish consistent with goal of seeing Jupiter S and L Bursts in some detail.  The FS200 is a sweeping type spectrograph as opposed to the more modern approach of using an FFT to derive a spectrum from a software defined radio or SDR.  Our system needed to save about 2000 two-byte samples per second.  Although back then this seemed like a lot of hard drive space, today saving a couple hundred megabytes per day is not a big deal.

In live mode, RSS provides two views of the same spectrum with different time scales.  This is useful for seeing the last minute of data and the last 10 minutes of data (depending on the sweep rate). For Jupiter this was optimum for seeing how the storm was progressing overall, and in detail.  It also turned out to be a good compromise for solar activity. We have found it better to have frequency on the Y axis and  time on the X. This is not the usual format for other SDR programs.  We use high frequency at the top in contrast to many scientific displays which chose the opposite convention for some reason I have never understood.

You can measure the slope of any feature on the spectrogram with just a couple of clicks.

Most SDR programs provide very useful waterfall spectral displays, but I only know of one program other than RSS that allows you to save the reduced spectrum data, and I don't think it is out yet.  Most programs provide for saving the entire bandwidth that the SDR is processing, often millions of samples per second.  This is great for communications because you can go back and demodulate any signal in the bandpass from the saved signal, however, it is currently impractical for long periods of time to save that much data. For our radio astronomy purposes, we don't need all of that data unless we want to do some kind of imaging or interferometry.   Within the next couple years RSS is scheduled to provide support for saving files in NASA's CDF format which is a scientific standard. RSS has turned out to be a very practical display and file saving tool for event based radio astronomy.  RSS is free and can be downloaded here.  If using Win 7 or up I suggest you run tRSS as administrator so that Windows doesn't get mad about it writing to the program directory. You can use the program in Client Mode to view live spectra from other RSS users. Unfortunately, the help is minimal and out of date, but there is a group of people working on creating a manual for RSS.

Sold! How do I use RSS with my receiver?


If you want the functionality that RSS provides but you do not have one of the receivers RSS supports, you can send your data to RSS over a TCP connection as long as you format it properly.  This assumes you know how to get reduced spectral data from your receiver (or can reduce the raw data ) and  that you know how to do a little programming in Python, Java, VB, or whatever.

Your program must act as a TCP server and listen for a connection on port 8888 of the loopback address 127.0.0.1.   Configure RSS under Options /Radio to RTL Bridge / TCP. When you press the Start Button in RSS, it will attempt to connect to your custom software server. Your program should accept the connection and send this string back to RSS:

"F " & CenterFrequencyHertz & "|" &"S "& BandwidthHertz & "|" & "O " & OffsetHertz & "|" & "C " & NumberOfChannels & "|"

For example: F 21000000|S 5000000|O 0|C 500

This would tell RSS that the center frequency of the observation is 21 MHz.  The bandwidth is 5 MHz, so the display will run from 21 + 2.5 to 21 - 2.5 MHz,  or 18.5 MHz to 23.5 MHz. The O is for the offset and is useful for when a downconverter is used.  Here O is set to zero.  Finally, C denotes the number of channels.  This is currently limited to 100 - 512 channels. Each of these parameters is separated by the pipe symbol "|".

The data itself is in two byte binary format.  Each sample is sent as a binary word with LoHi byte order and should be restricted to 12 bit digitization.  The data is sent with the highest frequency first, descending to the lowest.  At the end of each sweep two FE hex bytes (254 decimal) are sent. and the next sweep begins. There are no timestamps.  RSS keeps track of the time and assumes an even sweep rate.

If you run into trouble just contact me at radiosky (at) radiosky (dot) com.  or via the comments. I would love to know if you write something that can send your spectra for display to RSS. Perhaps, you would like to share it with others.




Thursday, July 16, 2015

Charting Power from a RTL Dongle


Its been a while now since I wrote RTL Bridge and made it possible to pipe the total power from the receiver bandpass to Radio-SkyPipe (RSP) for display in a strip chart.  It occurred to me that I had never tested this in any more than a very superficial way.  If it works in some predictable way, then the dongle-RSP combo might be useful for making power measurements.  I even had a use for it, to measure the insertion loss of an inexpensive FM band trap at HF. I bought ten of the traps shown below for $0.67 each from MCM Electronics. The front ends of RTL based receivers are wide open (no rf filters) and thus with their limited dynamic range, are susceptible to overload from nearby commercial radio stations. An effective trap can help this problem.


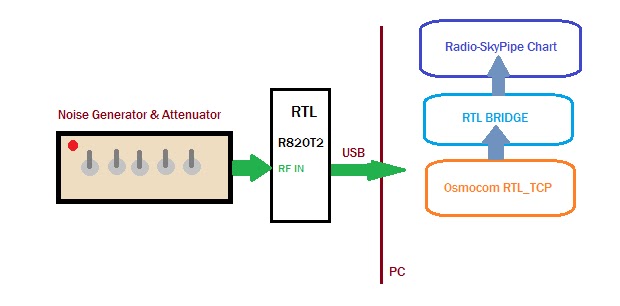
For this and most things, I use the RTL dongles with a 2 MSPS sample rate.  This translates to a 2 MHz wide bandwidth. For this test I have the gain set at maximum for the R820T2 tuner.  The center frequency is 20 MHz which means I am using the low frequency enabled version of the rtlsdr.dll.  I use 20 MHz because I have a noise source calibrated at that frequency (RF2080 C).  I also have a RF2010 noise generator with a built in binary step attenuator capable of  31dB total attenuation.  The noise temperature ranges from about 3000 Kelvin to 3200000 K. 
Basic test setup for determining how well RTL + Radio-SkyPipe can measure rf power.
Basically, the test procedure consisted of warming up the RF2010, and stepping through the binary switches (reversed to put the LSB on the left!) in one dB increments and using the Get Average function in RSP to  average the signal for 10 seconds. I manually wrote down each value on a sheet of graph paper.  The values read from RSP had no real meaning until I would later go back and create an easy straight line equation to relate the raw numbers to the power arriving from the noise generator. Simply calibrate.  What I hoped to see was a plot of a straight line but what I saw was this:

Measured output (Y) are raw values from Radio-SkyPipe.  The X axis is the amount of attenuation in dB removed from the path between the noise source (approx 3.2 million K)  and the RTL dongle receiver with a R820T2 tuner.caption


"Its not linear", I thought. It looks like it has a sinusoidal shape. If tried to find a function that makes the data conform with reality.  I would then apply the function to the incoming data using the RSP Equation feature so that the data would scale to something meaningful like noise temperature or dBm.  Even without calibration, RSP should be able to tell me how much loss incurs from inserting the FM Trap in line to the antenna (or noise source ).

I tried a couple of curve fitting calculators on the web to see if I could get a regression fit of some kind, Unfortunately none of the "curve fitters" made any improvement over a straight line fit. Divergence from my hoped for straight line may on the low end just be due to approaching the HF noise figure limitation of the RTL.  On the high end we may be reaching compression.  There is no filter in line with the 25000K noise source so the input of the dongle is exposed to a very wide band noise signal.

Good Enough

Along the middle 60% there is very good linearity which indicates that Dongle->RTL Bridge->Radio-SkyPipe combo performs well as a power detector at 20 MHz. Below about -93 dBm or 18000K and above -77 dBm or 772000K linearity suffers some. 

So back to the FM Trap insertion loss problem.   The question again is "Will the trap degrade my use of the RTL Dongle at 20 MHz?". So I measured using a noise source with a temperature that laid along the straight part of the line. No need for calibration because we are just interested in a relative measurement. I found the loss of the trap is below the threshold of what I can measure which is about a half dB. That is a totally acceptable loss, provided that the trap is doing what it should do, reduce the signal across FM band 88 - 108 MHz.  I haven't measured the bandpass above and below the FM band but I intend to try.  For kicks I want to use the dongle and a broadband noise source to measure the filter.

RF Noise Source NF-1000 SZ evaluation

  I have been working on an automated step calibrator project in recent months, so I was excited when I saw the device shown above on eBay. ...