Monday, March 2, 2015

HF Update to RTL Bridge

Amateur radio astronomer Jim Brown in Pennsylvania recently successfully used a RTL Dongle, Ham-It-Up converter, and a preamp/filter built by Richard Flagg, AH6NM.  Jim said I could use one of the images and here it is below.

Jupiter noise bursts captured by Jim Brown and an RTL Dongle plus RTL Bridge and Radio-Sky Spectrograph software.
I don't want to say too much about Jim's observation as I think he might write it up, but I can say that he was using my software, Radio-Sky Spectrograph (RSS), in conjunction with RTL Bridge.  This proof of concept observation should be encouraging to those who would like to make spectral observations of Jupiter and the Sun using an inexpensive dongle receiver.  Though not as informative as the 10 MHz wide spectrograms we have been seeing in the Radio Jove project, the spectral information does make it easy to identify Jupiter.

Recently I was able to take some time to experiment with Oliver Jowett's  low frequency patch for the Osmocom drivers that allows extending the range of the RTL+R820T below the usual 24 MHz limit without a upconverter or hardware modification.  Using a 2.04 MSPS rate, I was only able to see signals down to about 15 MHz, but many people have reported going much lower.  So while at the time I write this no one has recorded Jupiter with a "naked" dongle, I hope someone will give it a shot soon.  To help push that along I have repackaged RTL Bridge and RSS with the patched drivers.  I have also made a couple of changes to RTL Bridge and RSS.  In RTL Bridge there is now factor that can be used to scale the data appropriately for output.


The new Data Scale Factor is multiplied with the FFT power output before it is passes to RSS.  It was found that this was necessary to get readable deflections in RSS for weak signals.  The other scale factor, now safely tucked into a frame titled Local Display, That factor only affects the display in RTL Bridge and does not alter the data leaving for RSS. 

If you do not have RSS installed, then you can get it here:

http://radiosky.com/spec/Spectrograph.exe

If you have RSS installed and just want the latest updates go to:

http://radiosky.com/spec/Spectrograph_Update_2_4_21.exe

If you are new to this please read the other blog posts I have done on RTL Bridge. You should read the help page  if you have not yet used RTL Bridge.  Please let me know how it works out.


Thursday, October 23, 2014

RTL Bridge Gets an Update

RTL Bridge is a free Windows application that connects an RTL radio receiver dongle to Radio-SkyPipe and Radio-Sky Spectrograph data collection programs. You can read about it in the earlier post here.  I have been trying to make RTL Bridge a little easier to use by making it possible to update some of the receiver options on the fly, that is, without restarting the rtl_tcp.exe with new command line parameters.


In this version you need to stick with 128 or 256 as the FFT Size.  512 is causing an error.  You will see two new check boxes labeled RTL AGC and Tuner AGC.  Leave these unchecked for astronomical measurements. 

I had hoped to have spectrum stacking ability by now but it is harder than I thought, obviously.  Stacking would allow spectra wider than 2.4 MHz. 

If you just want the update go here, but if you are trying to write an application that works with rtl_tcp.exe (like I did) then you may be interested in how to send commands to it.

The Osmocom application, rtl_tcp.exe, actually handles all of the direct communications with the RTL receiver. Rtl_tcp.exe streams data over a TCP connection to RTL Bridge, but it can also receive commands that it then translates and passes on to the radio receiver to set the frequency, gain, sample rate, and other parameters.  The source code for rtl_tcp.exe can be found here.  Below is a copy of the first few lines of the code section that interprets the commands it receives from a client (RTL Bridge, SDR#, etc.) connected via TCP. 

switch(cmd.cmd) {
case 0x01:

// if the command byte is 01 then the parameter is the new frequency
// send that to the appropriate routine to set the frequency of the receiver

printf("set freq %d\n", ntohl(cmd.param));
rtlsdr_set_center_freq(dev,ntohl(cmd.param));
break;
case 0x02:
printf("set sample rate %d\n", ntohl(cmd.param));
rtlsdr_set_sample_rate(dev, ntohl(cmd.param));
break;
case 0x03:
printf("set gain mode %d\n", ntohl(cmd.param));
rtlsdr_set_tuner_gain_mode(dev, ntohl(cmd.param));
break;
case 0x04:
printf("set gain %d\n", ntohl(cmd.param));
rtlsdr_set_tuner_gain(dev, ntohl(cmd.param));
break;
case 0x05:
printf("set freq correction %d\n", ntohl(cmd.param));
rtlsdr_set_freq_correction(dev, ntohl(cmd.param));
break;


The command consists of a single byte with the command number (above represented by the case statements) and 4 bytes that represents any value associated with the command, a long integer.  This can hold the frequency, sample rate, etc.
In RTL Bridge, I use the following VB6 code to send a command to rtl_tcp.exe :

Dim FH as string
Dim buf(4) as byte
 
FH = Hex$(RTL_Frequency)
    While Len(FH) < 8
        FH = "0" + FH
    Wend
    buf(1) = Val("&H" + Left$(FH, 2))
    buf(2) = Val("&H" + Mid$(FH, 3, 2))
    buf(3) = Val("&H" + Mid$(FH, 5, 2))
    buf(4) = Val("&H" + Mid$(FH, 7, 2))
    buf(0) = 1 ' This is the command byte - command 1 sets the frequency.
    Socket1.WriteBytes buf, 5
 
(The last statement relies on SocketWrench control from Catalyst software.) Of course there are other ways to do this, but this is not a routine that is time critical so it is OK to use string parsing and the HEX$ function.  I did it this way because it made it easy to manipulate the byte order sent to rtl_tcp.exe.  From this you should be able to deduce a way to send the command. 


Friday, September 19, 2014

Arduino to Radio-SkyPipe via Ethernet

Recently, I received an email from someone wanting to put Radio-SkyPipe (RSP) on a Raspberry Pi or some other microcontroller based platform.  He wanted a low power consumption system for a remote location.  I also have an off-grid location that I also would like to access remotely.  A microwave Internet link is available but I do not want to run a remote computer full time as it would severely tax the small solar panel system.  Maybe this will help both of us.

Some time ago I developed a connection to Radio-SkyPipe to an Arduino controller via a serial connection.  By placing enough "intelligence" in the Arduino to communicate directly with RSP using the UDS protocol, we eliminate the complexity of having a specially written UDS "driver" program that sits between RSP and the data collection device (the analog to digital converter on the Arduino).  If you haven't read that post please do.  It will make this post seem much more intelligible. Of course, the range of the serial connection is limited unless we use a modem (remember those?)  Fortunately, Arduino Unos support an Ethernet shield which can then be connected to a LAN or WAN.

Image of the official Ethernet shield taken from the arduino.cc website.

The official Arduino Ethernet shield costs about $38.  I advise that you buy an official board as I have heard stories of incompatibilities with some of the cheaper knock-offs. There is also a WiFi shield that can be purchased for Arduino but I do not have one to test.  I assume operation would be similar to the Ethernet shield.  For my purpose, I have a router at the remote location and can just plug into that directly. A SD card slot is available on the Ethernet shield and it could be very handy for storing data locally in case there is a network failure.  A 4 Gig SD card could handle more than 10 years worth of data from one channel at 10 samples/second.  The code I am passing on to you right now doesn't store the data locally, but perhaps I can add that feature in a future post.

You must include the Libraries needed by the Ethernet shield; SPI and Ethernet.


You must apply the right settings to your Ethernet shield.  There should be a sticker on the board that holds the MAC number for the chip.  You will need that.  You will also need the IP address that you want the board to use.  The gateway and subnet mask can be retrieved from your router. The docs say they are optional but I included them.

byte mac[] = {
  0x90, 0xA2, 0xDA, 0x0D, 0xFB, 0x03 };
IPAddress ip(192,168,1,60);
IPAddress gateway(192,168,1,1);
IPAddress subnet(255, 255, 255, 0);


// the default UDS port = 1377
EthernetServer server(1377);

Initialize the Ethernet device in your setup {  } routine
  Ethernet.begin(mac, ip, gateway, subnet);
  // start listening for clients

 
It was a simple matter to change the original serial code to the Ethernet version by replacing Serial.print() and similar statements with client.print().

I did have to move the workings of the old data fetch and send routine GETD() to within the main loop so the client object would be in scope to send the data back to RSP. So when you see two identical blocks of code it is because I could not keep them as a separate subroutine, probably because I am new to this.  It makes me feel like a baaaad programmer.

At first I had a problem getting RSP to re-connect to the Arduino after I had canceled a connection. It was necessary to add the following lines to break the connection from the Ethernet boards perspective.

     if (!client.connected()) {
        //Serial.println();
        //Serial.println("disconnecting.");
        client.stop();
      }


Note there are //Serial.print() statements peppered through the code.  These can be uncommented if you want to use them for debugging. Just uncomment the appropriate lines, and use the Arduino IDE Serial Monitor to get feedback as you work on your program.

 Of course, you will change the analog data read to whatever you want to record. This is just a bare bones program. You could add DHCP, additional channels, a local clock for timestamping data saved to SD card. A Telnet or Web Server interface could allow you log in and turn things off and on at the remote site. There are already libraries and example code out there to piece together a lot of functionality using not too much electrical power.  Let me know what you come up with.

Get the sketch here.


Obligatory 2D etch-a-sketch using a pot.

Tuesday, August 26, 2014

Fear of Failure in Amateur Science


We all get things wrong.  Let's skip the nearly endless list of reasons why, and just accept it at the outset.  Of course, we usually have no problem accepting that another person has made an error.  It is mostly ourselves that we struggle with.  We don't want to fail or have others see us as failures so we shield ourselves from these things by:
  • Never doing anything with a possibility of failure...or
  • Adopting an unwarranted sense of infallibility.
Of course, most amateur scientists love learning new stuff even at the price of being wrong about what they thought they knew.  Isn't that the rush we all look for, that tingle of discovery? Surely, most everyone into science understands that sensation. We all know that science is the endless process of finding out we were wrong or at least more ignorant than we had thought ourselves to be.

Sadly, this high rate of idea turnover, does not play too well in our fragile hominid psyches.  We also like certainty, and we especially like it if it is our own idea that we are certain about. So what's the problem?  If we get it wrong, we just switch on Turbo-Intelligence and leave our simian insecurities behind. Unfortunately, intelligence most often comes with a great deal of rationalizing ability. Turbo-intelligence is just that much worse.  It is much easier to come up with things to support your hypothesis than those that would unequivocally refute it.  (Note the different standards we require of each!)

When defending your position becomes more important to you than your love for truth, you have become not a scientist but rather a politician in a lab coat.  As hard as we try not to, we tend to make this mistake over and over again in our lives, and more to the point, in science.  As amateur scientists, we are more likely to lose our balance in this regard than a professional scientist who has endured years of scrutiny under the eagle eyes of their peers. But, even professional scientists succumb.  They can rationalize VERY well.

We can fight the problems arising from our very human fear of failure by being good citizen scientists, with an emphasis in 'citizen'. We should foster a climate in our science communities that encourages amateurs to share their efforts via the internet in Groups, personal, and community websites. Hiding away in a basement laboratory with no contact with other amateur scientists is one certain way to make sure our efforts will never be criticized.  It is also a way to almost ensure that our work will not be of the quality that it could be had we shared it with others. So come out and smell the formaldehyde.   We can tell each other we are wrong (or right!) in supportive and kind ways.  We must not tolerate harshness or rudeness by others in our groups. Arrogance of any type is the enemy of science.

Humbly Submitted!
JS


Sunday, July 27, 2014

RTL Meets Radio-SkyPipe and RS Spectrograph


Eureka... sort of. 

I have written an application that allows you to use inexpensive RTL dongle radios to feed my strip chart program, Radio-SkyPipe (RSP), and my Radio-Sky Spectrograph (RSS), with wideband data.  The program is called RTL Bridge.  I have never claimed to be an imaginative program namer. It works like this:

 
I consider this experimental as of now, and invite others to test RTL Bridge with RSS and RSP.  If you think you want to try it read the help file here. You will need to install RSS if you have not done so and if you already have it installed, you will need the new update.  It is all in that help file. RSS is free by the way.  This could be the start of a nice hydrogen line study for very little money.


Thursday, August 29, 2013

Radio-Sky Spectrograph


A beautiful solar storm.


Spectra displays sure have become popular.  When did you see spectra in the 1960s if it wasn't due to a rainbow or a mushroom?  Now our stereos and radios are very likely to have some sort of spectral display. Adding that extra dimension of frequency reveals patterns that cannot be discerned through a speaker or on a strip chart.   In the not too distant past, motors turned capacitors that tuned receivers that output spectra in terms of modulated light.  This in turn exposed a slit across  a slowly passing strip of photographic film.  Now we can simply? sample the entire HF spectrum with an insanely fast analog to digital converter, run it through a computer and, bang your done.  These new fangled technologies!


It was over 11 years ago that the Radio Jove Project received funding to develop a spectrograph that could be used to see Jupiter and Sun radio emissions in the HF range from 18 to 30 MHz  The device we built was designed by Richard Flagg and me over a period of more than a year.  We had earlier had produced spectra by sweeping a Icom R8500 receiver using serial connection to PC.  This actually produced some interesting spectra, but it was too slow to see the short duration S-Burst type of Jupiter radio emission. What's an S-Burst ?  According to the UFRO:

"The S bursts (S for Short) are very short in duration, have instantaneous bandwidth of a few kHz to a few tens of kHz, and drift downward in frequency at a rate of typically -20 MHz/sec. They arrive at rates from a few to several hundred bursts per second. In a 5 kHz bandwidth receiver they last for only a few milliseconds"

So we only had half of a second before the S-burst traversed the entire 10 MHz we were observing (18 to 28 MHz usually). By sweeping at 10 scans per second in the high to low frequency direction, we get at least 5 chances to see the S burst as it makes it's decent.


FS200 prototype.


Dick designed all of the analog electronics and I did the digital stuff and supporting software. Dick also built the spectrograph  (shown below) and he really did a beautiful job, that any geek would envy. Had I built it, would have looked more like the prototype shown above.  The result was a sweeping receiver that measured the radio energy in each of 200 channels about 10 times each second.  The more modern approach would of course be to use a software defined radio that samples the entire HF band simultaneously.  That would have been quite a challenge that long ago, so we took the more well trod path of sweeping a single channel receiver in the style of the older spectrum analyzers. We called the spectrograph the FS200, (Flagg-Sky 200 channels - which we named is a very self-congratulatory moment).  It was installed in the Windward Community College radio observatory on Oahu, Hawaii, and is still running non-stop today.


FS200B production model spectrograph with an automated step calibrator on the bottom panel. Everything can be controlled remotely via the serial port attached PC. From the front of the rack you just see an led, reset button, and perhaps a switch (can't remember). Basically, a DDS controls a receiver with a log detector. A micro-controller manages everything.


The results were beyond our expectations.  We could see Jupiter spectral emissions in detail that only the Nancay observatory in France could outdo. OK, I have no proof or even evidence of that, but it would be nice if true.  A second instrument was built and coupled to the then viable University of Florida TP array.  Unfortunately, thieves have since decided the unmanned observatory was more useful as a source of scrap metal than as a scientific facility.  Luckily the FS200B was saved and has been relocated. It is currently operated by Dave Typinski.  Dave, Wes Greenman, and Jim Brown have been putting instruments to use and producing spectacular results.  More spectrographs will be coming on line over time and of course the WCCRO machine is almost always available for viewing though it sometimes has interference issues.


A Jupiter noise storm showing intricate structure.
Several years ago Kazu Imai of 
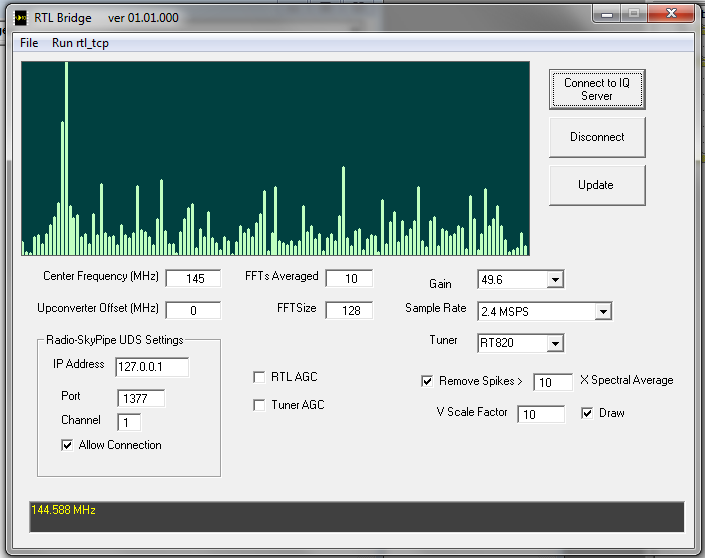
Agawa Observatory in Kochi Japan commissioned me to modify the Radio-Sky Spectrograph software (RSS) to work with rfspace's SDR-14 software defined receiver.  Rfspace sharply foresaw that others might want to write programs for the SDR-14 and provided an easy to use ActiveX interface to the spectral data within. That made supporting their device possible. The Japan based SDR-14 is not available on line, but I mention it as a possible commercial device for people who would like to have their own spectrograph that works with RSS.  The SDR-14 no longer is produced, but occasionally you will see one offered for sale in the SDR-14 users group.


RSS in Client Mode. Four servers were available at the time this was copied.


But anyone can download and use RSS and link to one of several spectrographs that are available over the internet.  The software is completely free. RSS has Stand Alone / Server / and Client modes just like Radio-SkyPipe.   Of course, you need an SDR-14 or one of Richard Flagg's custom receivers to use the first two modes.  I will apologize beforehand that there is not much in the way of help available for users of the program.  Let me know if you get stuck on some aspect of the program.

Strong solar bursts.

More recently we developed a "stereo" version for looking at right and left hand signals simultaneously.  This project was commissioned by Dave Typinski and we really hope to see some great results from this device in the upcoming Jupiter season. 

Friday, August 16, 2013

A Beautiful Analog Voltage Meter

I do not remember when or where I purchased this meter but I always fantasized about using it as the output of some modern complex circuit. I suppose that might be called a vaguely steampunkish idea.  In any case, I feel compelled to share this elegant design with you.

This voltmeter covers up to 20 volts. Once zeroed, I found that it tracked very precisely with an applied voltage as measured on a DVM. What is unusual about the meter is the pointer which manifests as a floating triangle of light projected onto the vertical scale from behind.


 The light source is a 6 volt incandescent bulb.  I power it  with a 6.3 VAC transformer rated for a couple of amps.  I didn't measure the actual current but small power transformer gets quite warm! The bulb is very bright, making the meter difficult to photograph. In normal operation the meter would be in an enclosure and the light would be hidden except for the arrow image projected through the translucent linear scale.

This is what I saw after removing the numerous small screws from the side panel.


The light bulb is positioned above the image and passes through a crisp metal mask that forms the pointer arrow shape.  The beam reflects from a fixed mirror on the opposite side of the case.  The reflected light then passes through a focusing lens and onto a mirror that is attached to a typical galvanic meter movement. This tiny mirror rotates with the shaft axis of the meter movement.  The change in angle dictates on what portion of the linear voltage scale the pointer image falls.
 
 
To me this is a beautiful device.  I must find a use for it.  Unfortunately, it wastes a lot of power in that bright bulb.  Either I must find a very occasional use for the meter or find a way to reduce how much power it uses.  The scale would be perfect for measuring voltage from a PV system, but wouldn't it be ironic if the meter consumed all the power from the solar cells.


Wednesday, April 3, 2013

Chart Your Solar Panel Voltage

A friend of mine gave me some of his old photovoltaic, (PV), solar panels.  The frame they were on had disintegrated and they had not been used in a long time.  I was thrilled to have them.  I decided it would be good to characterize them simply by following their voltages over a few days.  I laid them out in the yard and ran a cable back to my shop a few feet away.  The series connected voltage measured with a DVM showed it to be in the expected range, never to exceed about 20 volts. 

A new life for some old PV cells.

An old, junker laptop was available, so I combined it with a LabJack U3 - LV  analog to digital converter (ADC)  and my Radio-SkyPipe data logging program. The LabJack is really more than just an ADC. While here I am only interested in measuring the voltage from the panel the LabJack U3 can detect digtal states on some of its inputs and can output both digital and analog signals.    The input range for the U3-LV (Low Voltage) is 0 to 2.4V in the singled ended configuration so I needed to reduce the voltage from the panels to fit in this range.  A resistive voltage divider was called for.  I decided to just use a 5K pot (variable resistor) instead of a calculator and a couple of fixed resistors.  Using the pot has the advantage that it can be changed if you would like to alter the range or compensate for a impedance other than that presented by the LabJack analog input. 

LabJack U3-LV fed from a pot used as a voltage divider attached to the PV panel output.
Before hooking anything to the LabJack input:  The outer terminals on the pot should temporarily go to the positive and ground of a regulated variable DC power supply.  I adjusted the power supply to 20V and then the wiper arm of the pot so that it read 2.4 V.  Only then connect the wiper arm to the LabJack analog input. You may need to slightly retweak the pot after the connection is made.

This arrangement means that when read by the ADC,  20V will be produce a reading of 4095.  Each step from zero to the full input voltage is 20/4096 = 0.0048828125 Volts.  Forgive the ridiculous precision.  I wanted to read the voltage in volts, not the number of 0.0048828125ths of a volt, so I used the Equation feature of Radio-SkyPipe that allows you to apply a function to the data read from the ADC. The Equation function is simply X*0.0048828125 .

It would be a simple matter to extend the functionality of this arrangement so that it could function as a Battery Charge Controller.  I mentioned above that the LabJack U3 has a number of digital ports.  We can use one these output ports to toggle a relay that connects the panels to the storage battery.  Hidden away in the Radio-SkyPipe program on the Misc. tab of Options, you will find the Triggers button.  You may configure triggers that are activated by incoming chart data (in this case the PV output voltage).  These triggers effect real world outputs, like the LabJack output we are using to control the battery charging relay.  When the PV voltage drops below some minimal charging voltage, the relay opens disconnecting the voltage source from the battery. The photocells actually can draw current away from the battery when they are not adequately illuminated. A diode in series with the + line from the panels can also do the job at the sacrifice of the 0.7V or so that drops across the diode junction.  A second Trigger may be configured to remove the PV charging voltage when it exceeds a limit corresponding to overcharging.  Overcharging can seriously affect battery life.  I am no battery expert, so I will leave it to you to research the voltage thresholds you want to use.

Whether or not you use RSP as a charge controller, it can be informative to monitor the voltages in your PV system over days or even over seasons.  This information can be helpful in making adjustments that optimize your energy collection and usage.

Effective Apertures of non-Dish Antennas

I published this article on my website over 20 years ago. Richard Flagg AH6NM should be listed as a co-author as he provided much of the log...